Wednesday, September 16, 2026

AI Data Center Optical Suppliers Face 30% Demand Shortfall Through 2027

Optical networking suppliers are undershipping AI infrastructure demand by approximately 30%, with Lumentum's order backlog exceeding $400 million and EML capacity locked in long-term agreements through late 2027. The supply crisis directly impacts hyperscaler data center buildouts and corporate technology spending plans.

AI Data Center Optical Suppliers Face 30% Demand Shortfall Through 2027
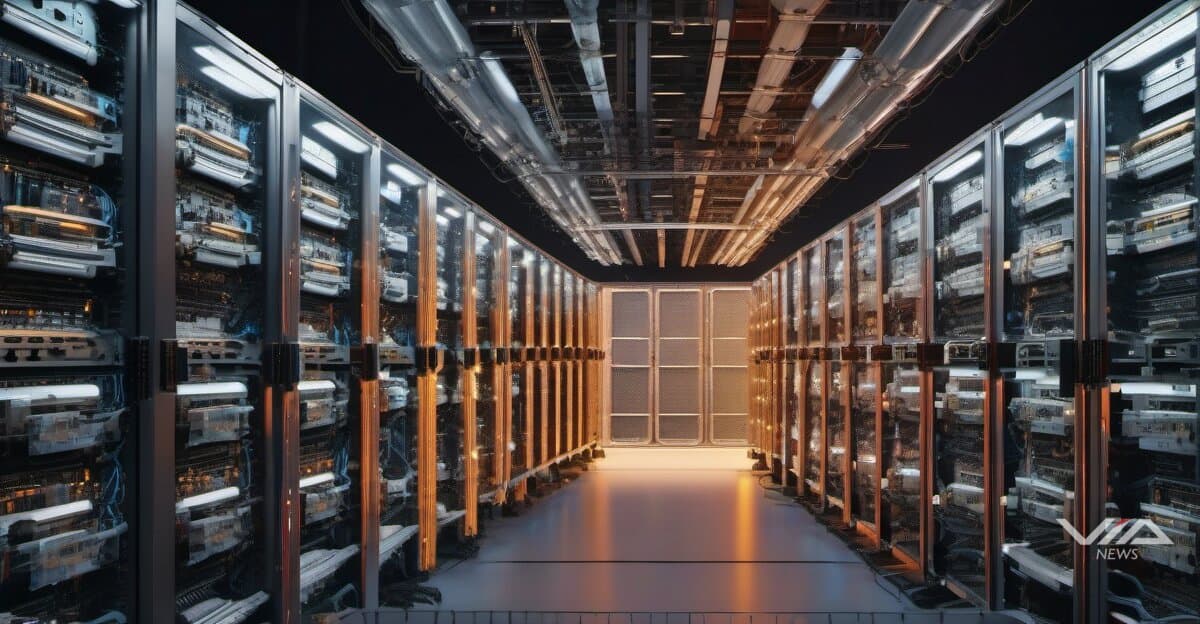
Image generated by AI for illustrative purposes. Not actual footage or photography from the reported events.

Optical transceiver manufacturers are shipping 30% below actual demand from AI data center operators, creating a multi-quarter supply crisis that will constrain technology infrastructure spending through 2027.

Lumentum, a primary supplier of optical components for AI networks, holds an order backlog surpassing $400 million, with most shipments scheduled for the second half of 2026. The company's electroabsorption modulated laser (EML) production capacity is fully allocated under long-term contracts extending through calendar year 2027.

The shortfall centers on optical circuit switches (OCS) and high-speed transceivers required for AI training clusters. As suppliers add manufacturing capacity, demand growth is outpacing new supply, widening rather than closing the gap.

Hyperscale cloud providers—the primary customers for these components—face extended lead times for optical networking equipment essential to GPU cluster connectivity. A single AI training facility requires thousands of optical transceivers operating at 800 gigabits per second or higher.

The supply constraint creates a cascading effect on corporate capital expenditure. Companies planning AI infrastructure deployments must either accept delayed timelines or secure supply allocations quarters in advance, tying up capital in long-lead purchase commitments.

Equipment lead times have extended from typical 8-12 week periods to 6-9 months for high-speed optical components. This delay directly impacts when new AI compute capacity becomes operational and revenue-generating.

For technology sector valuations, the bottleneck creates divergent effects. Companies with secured optical component supply gain competitive advantage in bringing AI services to market. Those without allocations face delayed product launches and extended cash conversion cycles.

The optical networking sector now represents a critical constraint on AI infrastructure scaling. Lumentum's position as a foundational supplier to virtually every major AI network gives the company pricing power, but capacity limitations cap near-term revenue regardless of demand levels.

Financial planning teams at corporations deploying AI infrastructure should model 6-9 month procurement cycles for optical networking components and consider securing long-term supply agreements despite the capital commitment required.

What we know · the intelligence behind this page
Live from the substrate
What we're seeing
AI's 'Show-Me' Reckoning: Earnings Divergence, Executive Exodus, and Regulatory Tightening
Investors are shifting from rewarding AI narratives to demanding tangible results, evidenced by Adobe's weak guidance despite user-growth emphasis, Palantir's stock decline even after winning the Army's TITAN contract, and UiPath's contrasting guidance raise. Simultaneously, high-profile safety-driven departures from Anthropic and Google, plus new regulatory actions (California's under-16 social media ban, Anthropic's misuse-blocking disclosures), signal mounting scrutiny of AI's societal and financial risk profile even as fintech-adjacent funding (Socure) continues.
Our read on the data ›
Signals we're tracking
Satellite-Terrestrial Network Integration Acceleration
Increased investment and launches in hybrid satellite-cellular networks across telecom industry; competitive responses from other carriers; regulatory activity around satellite spectrum; expansion of emergency/rural connectivity use cases
Patterns we're watching ›
Where sources disagree
ING Group
Both facts record the same metric (shares_outstanding) for ING Group at the identical observation date (2025-12-31). FACT A states 2,902,437,688 shares; FACT B states 2,902 million shares (2,902,000,000). The difference is 437,688 shares (~0.015%). This is a genuine value conflict, though the discrepancy appears to result from FACT B rounding to the nearest million while FACT A provides the precise count.
We flag conflicts openly ›
Recently verified
Checked against the original source
4,981
facts traced to their source — and we flag the ones that don't hold up.
101 entities tracked4,981 facts checked against source5,288 source documents archived
Query this data → isubstrate.com