Wednesday, September 16, 2026

Lumentum Undershipping AI Photonics Demand by 30% Through 2027, $400M+ Backlog Signals Multi-Year Supply Crunch

Lumentum is delivering 30% below customer demand for photonics components critical to AI infrastructure, with all EML capacity locked in agreements through end-2027. The company's OCS backlog has surged past $400M, most shipping in H2, while capacity additions only widen the demand-supply gap.

Lumentum Undershipping AI Photonics Demand by 30% Through 2027, $400M+ Backlog Signals Multi-Year Supply Crunch
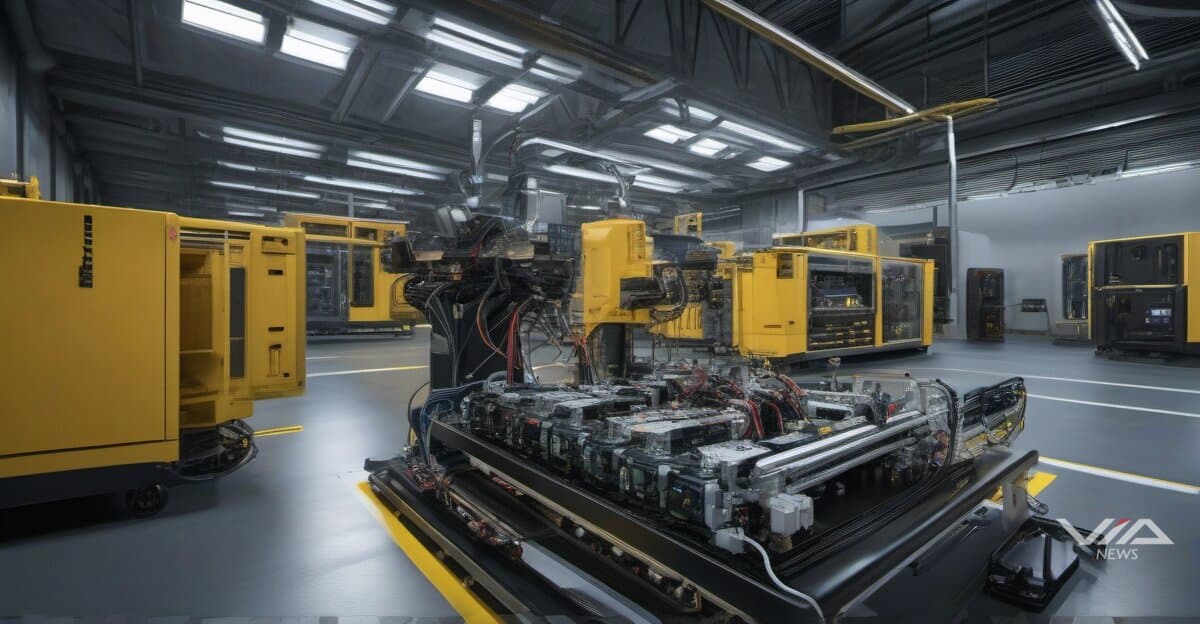
Image generated by AI for illustrative purposes. Not actual footage or photography from the reported events.

Lumentum is shipping 30% below customer orders for photonics components that power AI network infrastructure, signaling a sustained supply crunch that extends through calendar 2027. All externally modulated laser (EML) production capacity is committed under long-term agreements running through at least end-2027, leaving hyperscalers competing for limited allocation.

The company's optical communications (OCS) backlog has climbed past $400 million, with most units scheduled for second-half delivery. Management added indium phosphide manufacturing capacity by over 20% in the December quarter alone, with further expansions planned. Despite these additions, the demand-supply imbalance is widening rather than closing.

Lumentum now positions itself as a foundational supplier to virtually every major AI network deployment. The component shortage creates multi-year revenue visibility for specialized photonics manufacturers, contrasting sharply with typical tech hardware cycles that see rapid supply-demand rebalancing.

For investors, this presents a rare scenario where capacity constraints drive sustained pricing power and order visibility. Companies holding long-term supply agreements gain competitive advantages in AI infrastructure buildouts, while those without allocations face deployment delays or higher spot-market pricing.

The bottleneck sits at indium phosphide wafer fabrication, a capital-intensive process requiring 18-24 month lead times for meaningful capacity additions. This creates a structural moat for incumbent suppliers with existing fab infrastructure. Coherent, II-VI, and other photonics players face similar demand dynamics.

Supply chain risk materializes in two forms: hyperscalers may need to adjust datacenter deployment schedules based on component availability, and equipment manufacturers lacking photonics allocations could lose market share to better-supplied competitors. The 30% undershipping rate suggests current AI infrastructure plans exceed realistic near-term delivery capabilities.

Long-term agreements through 2027 lock in customer commitments but also limit supplier flexibility to serve new entrants or faster-growing accounts. This favors established AI players with early supply contracts over later-stage entrants attempting to scale infrastructure rapidly.

What we know · the intelligence behind this page
Live from the substrate
What we're seeing
AI's 'Show-Me' Reckoning: Earnings Divergence, Executive Exodus, and Regulatory Tightening
Investors are shifting from rewarding AI narratives to demanding tangible results, evidenced by Adobe's weak guidance despite user-growth emphasis, Palantir's stock decline even after winning the Army's TITAN contract, and UiPath's contrasting guidance raise. Simultaneously, high-profile safety-driven departures from Anthropic and Google, plus new regulatory actions (California's under-16 social media ban, Anthropic's misuse-blocking disclosures), signal mounting scrutiny of AI's societal and financial risk profile even as fintech-adjacent funding (Socure) continues.
Our read on the data ›
Signals we're tracking
Satellite-Terrestrial Network Integration Acceleration
Increased investment and launches in hybrid satellite-cellular networks across telecom industry; competitive responses from other carriers; regulatory activity around satellite spectrum; expansion of emergency/rural connectivity use cases
Patterns we're watching ›
Where sources disagree
ING Group
Both facts record the same metric (shares_outstanding) for ING Group at the identical observation date (2025-12-31). FACT A states 2,902,437,688 shares; FACT B states 2,902 million shares (2,902,000,000). The difference is 437,688 shares (~0.015%). This is a genuine value conflict, though the discrepancy appears to result from FACT B rounding to the nearest million while FACT A provides the precise count.
We flag conflicts openly ›
Recently verified
Checked against the original source
4,981
facts traced to their source — and we flag the ones that don't hold up.
101 entities tracked4,981 facts checked against source5,288 source documents archived
Query this data → isubstrate.com