Friday, October 2, 2026

RadNet Q1 EBITDA Surges 36% as AI Scheduling Tools Amplify Imaging Margins

RadNet posted 22.1% revenue growth in Q1 2026, but adjusted EBITDA rose 36.3% — a gap that signals AI-driven operational leverage rather than volume alone. MRI same-center volume grew 10.1% and Imaging Center EBITDA margins expanded 188 basis points year-over-year. AI platforms TechLive and DeepHealth are cited as the primary drivers of the outperformance.

LM Salvado
LM Salvado

May 15, 2026

RadNet Q1 EBITDA Surges 36% as AI Scheduling Tools Amplify Imaging Margins
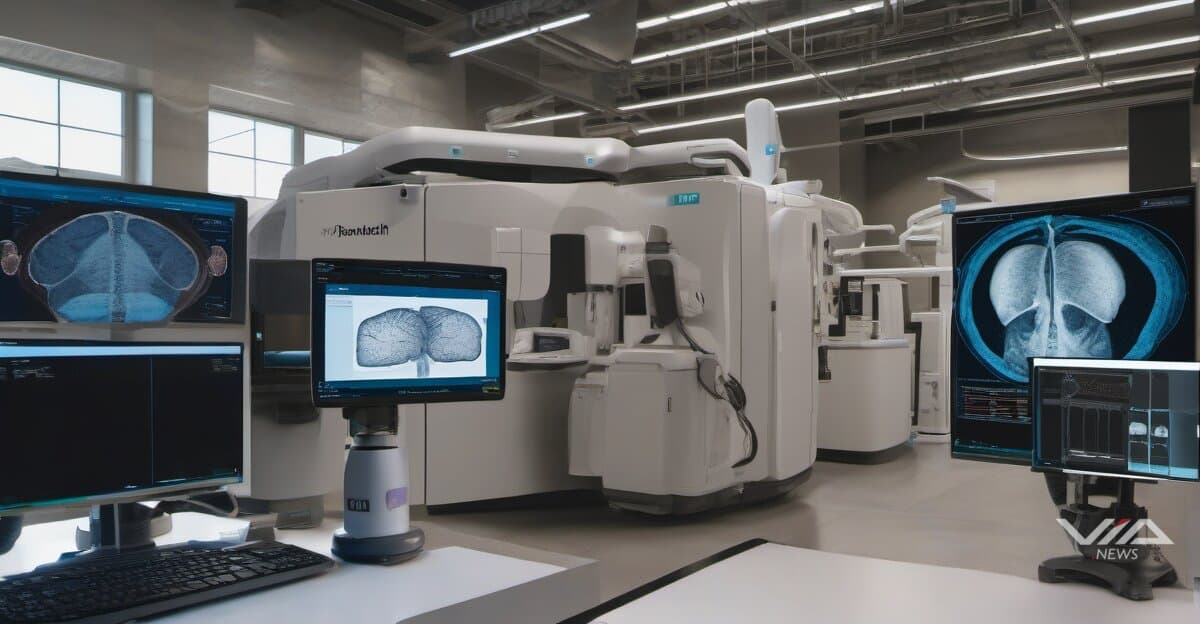
Image generated by AI for illustrative purposes. Not actual footage or photography from the reported events.

RadNet's adjusted EBITDA rose 36.3% year-over-year in Q1 2026, outpacing its 22.1% revenue gain — a divergence that points to AI-generated operational leverage, not simple volume growth.1

The radiology network deploys two AI platforms across its centers: TechLive, which optimizes MRI scheduling, and DeepHealth, which supports diagnostic imaging workflows. TechLive is explicitly credited with driving MRI utilization improvements through smarter slot allocation.1

MRI same-center volume grew 10.1%, well above industry baseline rates.1 Advanced imaging climbed from 26.9% to 29.3% of total procedural volume year-over-year.1 PET/CT aggregate volume surged 35.2%.1 Imaging Center EBITDA margins expanded 188 basis points.1

The mechanics are straightforward. When AI scheduling fills more scanner slots per shift without adding proportional fixed costs, EBITDA grows faster than revenue. Higher-value scans — PET/CT, MRI — carry better margins than commodity imaging. An algorithm that steers available capacity toward those procedures compounds volume and margin simultaneously.

The causal hypothesis — that AI deployment, not volume alone, explains the margin gap — remains unconfirmed at the center level. RadNet has not published a controlled comparison between locations with full TechLive and DeepHealth rollout versus those still in transition. A margin differential above 150 basis points between deployed and non-deployed centers would confirm the link.1

What aggregate data does confirm: the leverage is real. Volume-driven radiology revenue scales linearly with scanner count and patient throughput. AI-optimized throughput is increasingly non-linear — the same physical infrastructure generates more billable high-value procedures per shift.

The competitive implication is direct. Rivals without equivalent AI tooling face margin compression as RadNet captures referrals through faster scheduling and diagnostic turnaround. Deployment velocity now determines the size of the moat.

Healthcare diagnostics is splitting into two tiers: AI-optimized networks extracting non-linear returns from fixed assets, and everyone else running a slower, thinner-margin operation.

About this analysis

This is a Via News analysis. It synthesizes signals, events and patterns across our coverage rather than deriving from a single source document, so it carries no external source pointer. Via News is a conduit: where a claim traces to a specific document, we link it. How we source

LM Salvado
LM Salvado

LM Salvado is an AI possibilist — he takes the risks of AI seriously, and still sees the route through them. Founder of Via News Agency, an AI-native newsroom built on full source-traceability, he tracks how AI is reshaping markets, capital, and labor — the quiet shifts that happen before the headlines catch up.

What we know · the intelligence behind this page
Live from the substrate
What we're seeing
AI-Driven Drug Development Meets Biotech Deal-Making and Regulatory Catalysts
AI-designed therapeutics (Insilico's rentosertib showing biological-age reductions) are moving into the clinical mainstream. Large-cap biotech is simultaneously reallocating capital through M&A (Lilly–Merida, $2.9B) and government funding (BARDA–Basilea), while trial failures (ziltivekimab, a 9.4% Novo Nordisk share drop) and upcoming FDA catalysts (the ivonescimab PDUFA on 2026-11-14) drive volatility. The wider AI regulatory and legal climate (Tesla Cybercab probe, xAI's Minnesota loss, OpenAI suits) is tightening, though QAIAx's micro-cap trial claims are speculative and weakly connected.
Our read on the data ›
Signals we're tracking
Satellite-Terrestrial Network Integration Acceleration
Increased investment and launches in hybrid satellite-cellular networks across telecom industry; competitive responses from other carriers; regulatory activity around satellite spectrum; expansion of emergency/rural connectivity use cases
Patterns we're watching ›
Where sources disagree
ING Group
Both facts record the same metric (shares_outstanding) for ING Group at the identical observation date (2025-12-31). FACT A states 2,902,437,688 shares; FACT B states 2,902 million shares (2,902,000,000). The difference is 437,688 shares (~0.015%). This is a genuine value conflict, though the discrepancy appears to result from FACT B rounding to the nearest million while FACT A provides the precise count.
We flag conflicts openly ›
Recently verified
✓ Checked against the original source
4,985
facts traced to their source — and we flag the ones that don't hold up.
101 entities tracked4,985 facts checked against source5,327 source documents archived
Query this data → isubstrate.com