Thursday, August 27, 2026

Nvidia earnings on Feb 25 will test $2T AI hardware thesis as chip demand signals split

Nvidia reports Q4 2025 earnings on February 25, a key test for whether datacenter GPU demand can sustain the company's $2 trillion valuation. Broadcom's positive 2025 performance and Microsoft's Azure expansion suggest infrastructure spending remains strong, but Intel's Core Ultra Series 3 launch across 200 PC designs shows competition intensifying for AI-enabled devices.

Nvidia earnings on Feb 25 will test $2T AI hardware thesis as chip demand signals split
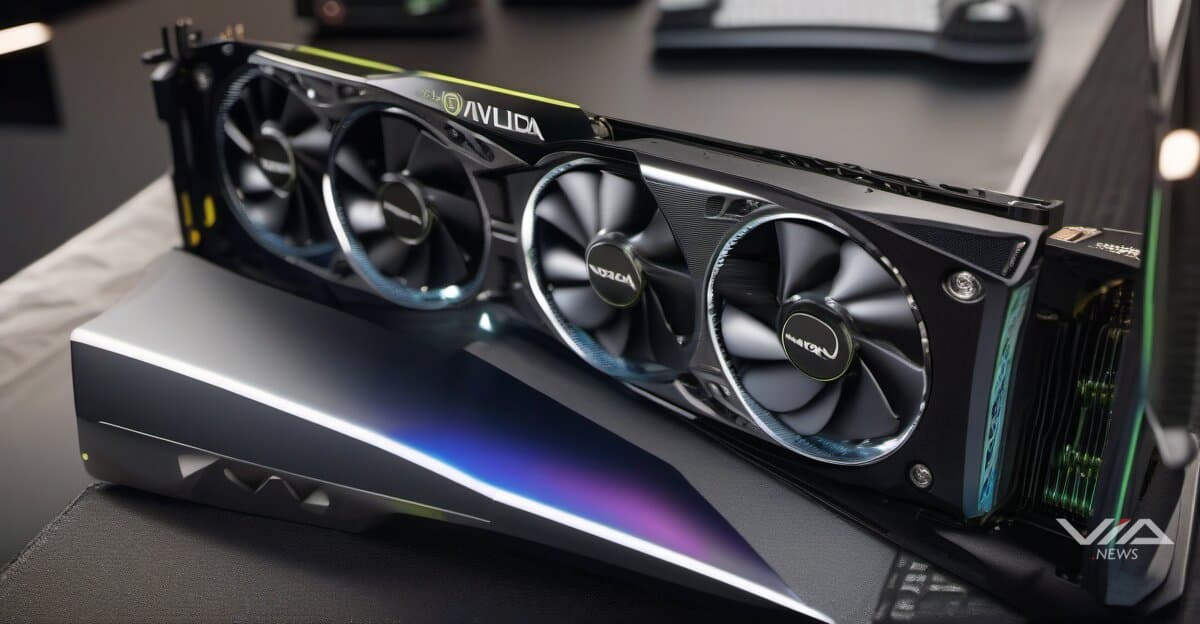
Image generated by AI for illustrative purposes. Not actual footage or photography from the reported events.

Nvidia reports Q4 2025 earnings on February 25, with analysts watching datacenter GPU shipments to gauge whether AI infrastructure spending can justify the chipmaker's $2 trillion market cap. The results will signal demand health across cloud providers and enterprise customers deploying large language models.

Broadcom's year-to-date gains through January 2025 indicate networking and custom AI accelerator demand held firm. Microsoft's Azure growth in Q3 fiscal 2025 (calendar Q1) drove continued capital expenditure on GPUs and accelerators, a trend hyperscalers must maintain to support generative AI workloads.

The test comes as competition broadens. Intel's Core Ultra Series 3 processors will power over 200 PC designs from global partners, pushing AI capabilities into consumer devices. Ensurge Micropower's microbattery technology targets edge AI devices, reflecting a shift toward distributed inference workloads that require less datacenter capacity.

Investors face a binary outcome on February 25. Strong Nvidia guidance would confirm datacenter buildouts continue through Q1 2026, supporting semiconductor equipment makers and memory suppliers. Weak shipment forecasts would suggest hyperscalers are pausing after two years of aggressive GPU purchases, pressuring valuations across the AI hardware stack.

Cloud capital expenditure announcements from Amazon Web Services, Google Cloud, and Microsoft Azure in their recent earnings calls showed no slowdown. AWS increased infrastructure spending 40% year-over-year in Q4 2024. Google parent Alphabet committed $75 billion to capex in 2025, much of it for AI training and inference chips.

The datacenter GPU market splits between training chips for frontier models and inference accelerators for deployed applications. Nvidia dominates training with H100 and H200 GPUs. Custom inference chips from Google, Amazon, and startups threaten lower-margin segments. Nvidia's earnings will show whether its inference revenue can offset any training slowdown.

Analyst consensus expects Nvidia Q4 revenue of $37 billion, up 70% year-over-year but decelerating from prior quarters. Guidance for Q1 2026 matters more than backward-looking results. Any revenue forecast below $35 billion would trigger semiconductor sector selloffs.

In this story · Knowledge Files

What we know · the intelligence behind this page
Live from the substrate
What we're seeing
AI Leadership Exodus Rattles Investor Confidence Amid Capex Boom
High-profile departures at top AI labs — Brad Lightcap's exit from OpenAI and an unnamed researcher's departure from Alphabet/Google that triggered a share-price drop — are surfacing talent retention as a market risk factor even as hyperscalers pour record capital into AI infrastructure. The reaction shows investors treating key-person risk at frontier AI labs as material to valuation, a new fragility layered onto an otherwise bullish AI-driven capex cycle.
Our read on the data ›
Signals we're tracking
EPKINLY Regulatory-Clinical Success Cascade
High probability of expanded label indications, additional combination approvals, and competitive positioning strength in follicular lymphoma market. Predicts positive commercial uptake and potential accelerated review for related indications.
Patterns we're watching ›
Where sources disagree
Broadcom Inc.
Both facts report EPS for Broadcom Inc. for the same fiscal period (Q1 2026) observed on the same date (2026-02-01). However, they report conflicting values: 1.5 USD per share vs 2.05 USD per share. This is a 37% difference for the identical metric and time period, not a value change over time.
We flag conflicts openly ›
Recently verified
Checked against the original source
4,978
facts traced to their source — and we flag the ones that don't hold up.
101 entities tracked4,978 facts checked against source5,251 source documents archived
Query this data → isubstrate.com