Friday, October 2, 2026

Fed Rate Pause Through Q2 2026 Threatens Banking Margins and Corporate Credit Markets

The Federal Reserve's monetary easing cycle, launched in September 2025, faces an extended pause through Q2 2026 as services inflation remains elevated. Chicago Fed President Austan Goolsbee confirms cuts depend on inflation moderation, while analysts see less than 1% chance of action before May 2026. The stalemate pressures banks' net interest margins and raises borrowing costs for corporations seeking to refinance debt.

Fed Rate Pause Through Q2 2026 Threatens Banking Margins and Corporate Credit Markets
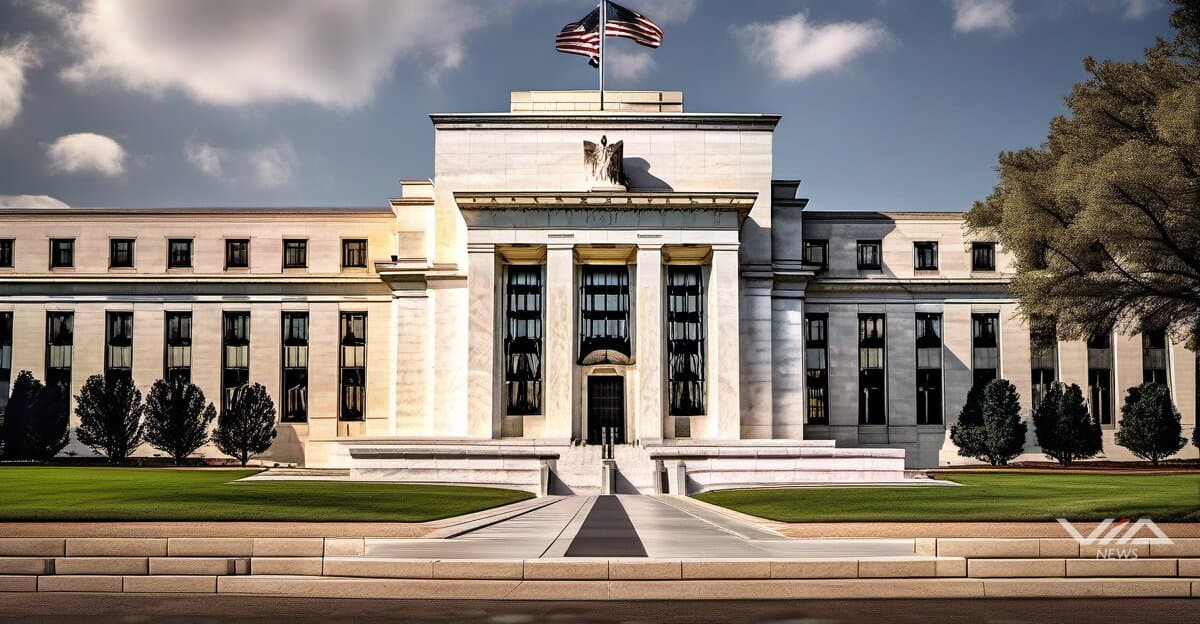
Image generated by AI for illustrative purposes. Not actual footage or photography from the reported events.

The Federal Reserve's rate-cutting cycle will likely freeze through June 2026, with policymakers citing persistent services inflation above 3.5% annualized. The central bank began easing in September 2025 but now signals caution.

Chicago Fed President Austan Goolsbee stated additional cuts require clear inflation moderation in the services sector. Geoffrey Kendrick, Standard Chartered analyst, puts odds of a May 2026 cut below 1%, marking the longest pause since the easing cycle began.

Banks face compressed net interest margins as deposit costs remain elevated while loan pricing stagnates. Regional lenders with heavy commercial real estate exposure see borrowers struggling to refinance at current rates, increasing default risk.

Corporate treasurers confronting $3.2 trillion in maturing debt through 2026 now expect refinancing costs 150-200 basis points above expiring obligations. Investment-grade spreads widened 45 basis points since January as companies delay bond issuance.

The Bank of Canada identified highly indebted households as a key vulnerability, a concern applicable to U.S. markets where adjustable-rate mortgages and home equity lines reset higher. Consumer credit stress typically precedes banking sector losses by 6-9 months.

Rate-sensitive equities including REITs and utilities underperformed broader indexes by 12% since easing expectations shifted. Growth technology stocks dependent on low discount rates for valuations saw similar declines.

Portfolio managers now advocate defensive positioning: short-duration bonds, value stocks over growth, and cash reserves near 15% of allocations. The "higher for longer" scenario demands strategies built for sustained restrictive policy rather than rate relief.

Credit markets price in Fed funds staying above 4.25% through year-end 2026, forcing corporations to preserve cash and delay expansion projects. Capital expenditure budgets fell 8% quarter-over-quarter among S&P 500 firms.

The policy impasse creates tactical opportunities in floating-rate securities and senior bank loans, which benefit from sustained higher rates. Investors shift from anticipating cuts to extracting yield in the current environment.

In this story · Knowledge Files

What we know · the intelligence behind this page
Live from the substrate
What we're seeing
AI-Driven Drug Development Meets Biotech Deal-Making and Regulatory Catalysts
AI-designed therapeutics (Insilico's rentosertib showing biological-age reductions) are moving into the clinical mainstream. Large-cap biotech is simultaneously reallocating capital through M&A (Lilly–Merida, $2.9B) and government funding (BARDA–Basilea), while trial failures (ziltivekimab, a 9.4% Novo Nordisk share drop) and upcoming FDA catalysts (the ivonescimab PDUFA on 2026-11-14) drive volatility. The wider AI regulatory and legal climate (Tesla Cybercab probe, xAI's Minnesota loss, OpenAI suits) is tightening, though QAIAx's micro-cap trial claims are speculative and weakly connected.
Our read on the data ›
Signals we're tracking
Satellite-Terrestrial Network Integration Acceleration
Increased investment and launches in hybrid satellite-cellular networks across telecom industry; competitive responses from other carriers; regulatory activity around satellite spectrum; expansion of emergency/rural connectivity use cases
Patterns we're watching ›
Where sources disagree
ING Group
Both facts record the same metric (shares_outstanding) for ING Group at the identical observation date (2025-12-31). FACT A states 2,902,437,688 shares; FACT B states 2,902 million shares (2,902,000,000). The difference is 437,688 shares (~0.015%). This is a genuine value conflict, though the discrepancy appears to result from FACT B rounding to the nearest million while FACT A provides the precise count.
We flag conflicts openly ›
Recently verified
✓ Checked against the original source
4,985
facts traced to their source — and we flag the ones that don't hold up.
101 entities tracked4,985 facts checked against source5,327 source documents archived
Query this data → isubstrate.com